Mobile App Monetization: Key Metrics
Nothing speaks louder than concrete figures, especially when you are pitching your mobile app idea to investors.
By using ROI forecasts and business development scenarios based on numbers, you will be able to demonstrate a clear vision to your potential financial backers. You will also show them that you know how to measure the performance of your prospective app once it has been launched.
Now you might be wondering where you can get those numbers.
This article will help you learn about the standard metrics that are currently used by industry professionals to get an insight into how well their product performs. Equip yourself with the understanding of your target audience, your killer features, and suitable app monetization options, and dive right in.
Operational App Metrics
Calculations for financial metrics often include operational data, so it is imperative that you first understand how to measure the overall performance of your app in terms of user engagement.
How long do users allow your app to take up space on their smartphones? How often do they interact with your app? How likely is an average user to abandon it? These and other questions can be answered in percentages and more specific units.
Let’s take a look at the operational metrics that mobile app businesses have been making a good use of to plan, measure, and analyze performance.
Customer Retention Rate (CRR)
The percentage of users who install and keep interacting with your app within a given period of time is known as the user retention rate, app retention rate or customer retention rate (CRR).
Use the following formula to get the figure:
Customer Retention Rate (%) = ((Num. of users at end of period — Num. of new users within the period) / Num. of users at start of period) × 100
Ask any mobile marketer, and chances are that they will name CRR as the most important operational metric. It has been in the focus of many marketing studies lately, so you can tap into the statistics and use real-life figures to plan your mobile app business.
According to Statista , the average customer retention rate for mobile apps worldwide was 32% in 2019, the second lowest after 31% in 2012.

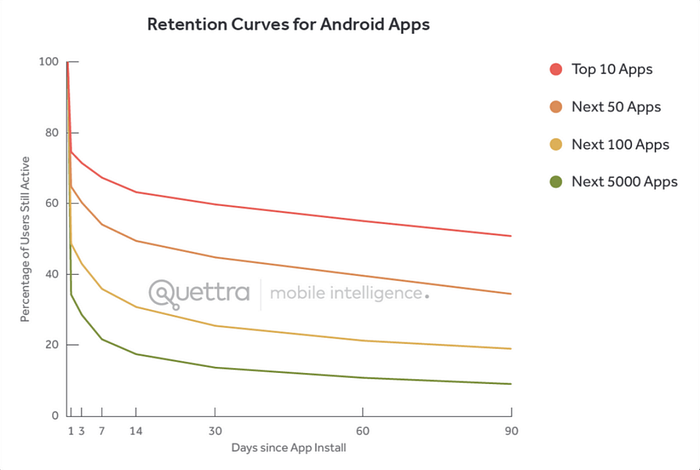
Andrew Chen, general partner at Andreessen Horowitz, presented some more interesting statistics on app user retention rates obtained through his collaboration with a mobile app intelligence startup, Quettra.
This research was conducted in 2015, when average customer retention rate for mobile apps was close to that of 2019 (see graph above).
The study shows that the average Android app lost 77% of its daily active users (DAUs) within the first three days after the install. Follow the retention curve in the graph below to see the decline in active users in 90 days.

Quettra also compared retention curves using Google Play ranking to see how top-ranked apps perform as opposed to the rest.
The study found that after the first week of usage, the drop-off for the top 10 apps accelerates to the same speed as the next 50, 100, and 5,000 apps:
Quettra also compared retention curves using Google Play ranking to see how top-ranked apps perform as opposed to the rest.
The study found that after the first week of usage, the drop-off for the top 10 apps accelerates to the same speed as the next 50, 100, and 5,000 apps:
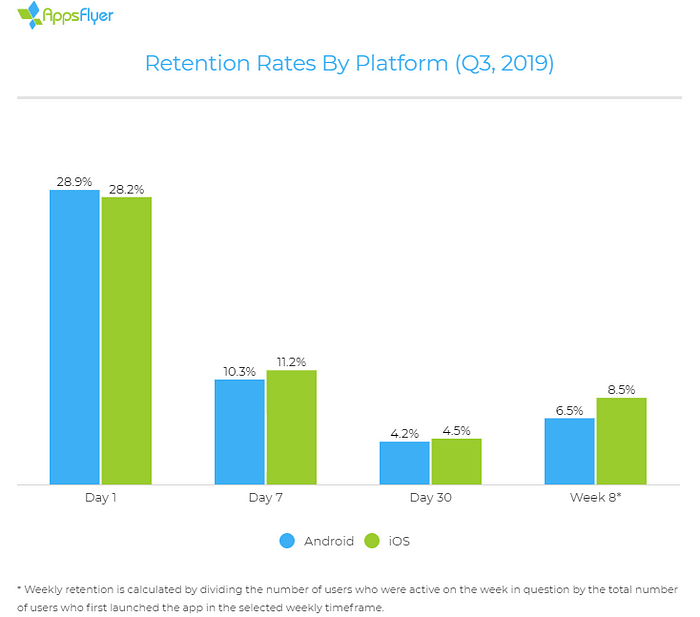
According to the recent research by AppsFlyer, here is how retention rates varied between Android and iOS throughout eight weeks in the third quarter of 2019:
Churn rate
Alongside CRR, the churn rate metric is an industry standard for assessing the performance of a mobile app. It is used to identify the percentage rate of users who stop being meaningful to the business within a particular time span.
There are two ways to calculate it:
a) Churn rate (%) = 1 — retention rate
b) Churn rate (%) = No. of lost customers / total No. of customers at the start × 100
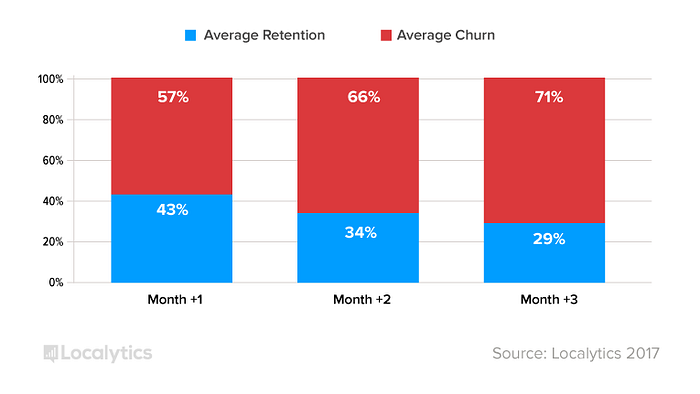
Churn and CRR go hand in hand. In 2017, Localytics analyzed the rate between these two metrics for the average app within three months. Here is what they found out:
According to Baremetrics, a 3–5% monthly churn rate and a 5–7% annual churn rate are acceptable. However, the acceptable churn figure depends on the size of a SaaS business. Larger companies spend more money to acquire customers and lock them with annual contracts, which means lower churn rates.
Chaotic-Flow notes that businesses that rack in over $10 million have a median churn rate of 8.5%, while companies that make less in revenue reach 20% in churn rate. According to the same source, this figure increases to 60% for the majority of startups.
Lifetime (LT)
Lifetime (LT) is a simple metric based on how long, on average, your app dwells on users’ smartphones until they delete it (churn) or stop interacting with it; you decide which of the two options to look at in your case.
LT (months) = Total months / Total users
Let’s say a user installs Uber at the age of 18 and uses it until she eventually passes away at the age of 86, which makes for 68 years or 816 months.
Another user installs Uber and uses it for five years until he deletes it in favor of Lyft, because the latter offers better value for price (at least in our example), which makes for 60 months.
And a third user deletes Uber after 25 years of living in the US because she moves to Germany, where taxi aggregators are forbidden. This is 300 months.
As a result, you have 1,176 total months of use. Divide this figure by three (the total number of users) and you will get the LT of 392 months, or 32 years and eight months, as the average user lifetime.
As you can see, it takes a considerably large user base to calculate LT so that this figure is meaningful.
Knowing LT will help you calculate a related financial metric: customer lifetime value.
FUUU factor
This metric will be relevant for you if your app is a mobile game or has gamification principles at its core.
Unlike most metrics, FUUU is not an acronym. It’s the gaming industry onomatopoeia for the exclamation that gamers make when they are unhappy with their experience. Marketers use it to assess the difficulty of achieving the next level in a game that can nudge a user to churn.
The formula is:
FUUU Factor (%) = No. of Attempts to Complete a Level / No. of Almost-Successful Attempts
Some game developers believe that a low FUUU Factor makes for “more motivated, enraged, and engaged” gamers, which helps to increase the app’s other operational performance metrics.
Return Rate
The return rate specifies the percentage of people who install your app and come back to use it on a particular day, week, or month.
User Return Rate (%) = No. of users who installed the app on Day A and used it on Day Z / No. of installs on Day A × 100
STANDARD/EXAMPLEs
DAU / WAU / MAU
Another way to measure the engagement rate of your user base over a period of time is by looking at daily active users (DAU), weekly active users (WAU), and monthly active users (MAU).
To calculate DAU, WAU or MAU, simply look at how many unique users opened your app within a day, week or month respectively. For the average figure, the formula would look like this:
DAU (users) = Total unique active users per period / Number of days
Stickiness
The stickiness metric is similar to return rate in that it shows you how often users come back to your app.
However, it uses a different approach to calculate this rate. Stickiness is a relation of DAU to MAU multiplied by 100 to be expressed in percentage. The formula is:
Stickiness (%) = DAU / MAU × 100
According to Andrew Chen, a good figure is 20%, while 50% and more is “world class”.
Financial App Metrics
Financial metrics will help you make sense and keep track of the monetary processes that are part of your mobile app business, such as revenue, costs, and user value.
As these metrics lie at the intersection of operational and financial data, they play a crucial role in forecasting ROI and generally planning the business.
Average Revenue per User (ARPU)
ARPU is the average revenue per user who has downloaded your app, regardless of what monetization model you choose. This figure is calculated as follows:
ARPU ($) = Total revenue / Total users
There is no one optimal figure for this metric. When evaluating your ARPU, take a look at your target audience, product, and marketing budget. How many users can your app acquire? How much revenue is your goal?
User Lifetime Value (LTV)
The lifetime value (LTV or the same Customer Lifetime Value (CLV)) of an app user looks at the revenue that a user generates within their lifetime (LT). There are multiple ways of calculating LTV, from formulas that include integrals and figures based on advanced stats, such as this:

where
GC = gross contribution per customer
M = (relevant) retention costs per customer per year
n = horizon (in years)
r = yearly retention rate
d — yearly discount rate
to much simpler calculations.
If you know your ARPU, Monthly expenses per user, and LT, you can use the simplest calculation possible:
LTV ($) = (ARPU — Monthly expenses per user) × LT
The LTV goal that is commonly accepted by marketers is LTV that exceeds by three times customer acquisition cost (CAC) or (and this is a better option) effective cost per install (eCPI), an important financial metric you will learn more about in this article.
Average Revenue per Paying User (ARPPU)
The average revenue per paying user (ARPPU) is relevant for apps that make money with in-app purchases.
ARPPU helps you see how much monetary value one paying customer brings to you on the average month, quarter or year. Here is how it is calculated:
ARPPU ($) = Revenue from in-app purchases / Paying users
Just like with ARPU, there is no golden standard for ARPPU as it depends on your business specifics. To evaluate this metric, you should ask yourself the same questions and one more: how much is my target audience willing to pay for using my app or its specific features?
Average Revenue per Daily Active User (ARPDAU)
If you want to know how user activity benefits your business, take a look at the average revenue per average DAU.
ARPDAU ($) = Revenue from in-app purchases, ads / Average DAU
This one is also a custom metric that hinges on multiple factors.
However, there is a popular notion among marketers that ARPDAU of about $0.05 is a healthy figure. Pokémon Go, for example, reached around $0.25 at the peak of its popularity.
Effective Cost per Install (eCPI)
Digital marketers use metrics like cost per install (CPI) to define how much it costs to acquire a new user. However, this concept provides only a limited picture.
We suggest looking at effective cost per install (eCPI) as it takes into account more than just what you pay per each new install.
Besides your promotional spend, eCPI factors in the organic installs that come from word of mouth and all the sources that you can’t keep track of. You can calculate it by using the so-called K-factor, the term that marketers use to describe the coefficient of virality. Hence the formula:
eCPI = CPI / K
Still, the K-factor is not always easy to extract, so we suggest a simpler calculation:
eCPI ($) = Total marketing spend / Total installs
As we mentioned earlier, the business situation can be considered healthy when eCPI is at least three times lower than LTV. Your goal should be a figure of around $1 for Play Store and $2 for App Store.
Cost per Install (CPI)
Cost per install (CPI) stands for how much it costs to acquire a new user — a metric similar to customer acquisition cost (CAC). This is one of the most important metrics in mobile app monetization as it allows you to forecast how much you will need to invest into marketing your app.
Calculate CPI this way:
CPI ($) = Ad spend / New installs from ad
The average CPI varies from platform to platform: from $1 when promoting through search ads to $2.53 for advertising on Twitter.
Advertising App Metrics
Almost every app on the market benefits from showing ads to its users, and yours is likely to be no different in that regard.
To get the most out of mobile advertising you need to know how the value of in-app ads is calculated for you as a publisher and your advertisers.
On the flip side, you will wear the advertiser’s hat yourself to drive in traffic and build a user base. This means that you will need to forecast and measure ROI of the ads you buy.
No need to reinvent the wheel here as marketers have long been using industry-standard metrics to calculate costs and value of ads run in apps.
Effective Cost per Mile (eCPM)
Effective cost per mile (eCPM) allows you to calculate the value of an ad per 1000 impressions, regardless of how many users interact with it.
Take the revenue from a specific advertiser for the given period of time, divide it by the number of times it was displayed within this period (impressions), and multiply the result by 1000. Here is what it looks like:
eCPM = Ad revenue / Impressions × 1000
This metric depends on your users’ location, your niche, your app’s speed and other factors. Marketers suggest to base forecasts on an eCPM value of between $4 and $10.
Fill Rate
Ad networks serve as intermediaries between app publishers and advertisers. When an app company offers a number of ad slots (ads requested) to a network, this network matches them with relevant advertisers. The app company gets paid for every ad successfully delivered to users of this app.
If a publisher requests ten ads, the network matches them with five advertisers based on their target audience, and the app fails to deliver one ad due to a technical error, there will be four delivered ads. Based on that, the Fill rate formula is:
Fill rate = Ads delivered / Ads requested × 100
Although this metric is based on advertising analytics, it can also be considered an operational metric as it provides valuable insights into the business performance of your app.
Apply fill rate to make it clear who your target audience is by assessing how many ads a network matches you with, as well as to measure the technical efficiency of your ad delivery and spot errors.
As a publisher, your goal is 100% ad fill rate.
Click-Through Rate (CTR)
You might have heard this acronym in SEO. However, this concept is more or less universal and can be applied to measuring the performance of your ad campaigns.
Click-through rate (CTR) stands for the percentage of users who have followed a link in whatever format it was presented to them, be it a banner ad or a text hyperlink.
CTR is calculated through this simple formula:
CTR = Total Clicks / Total Impressions × 100
According to Google Ads, the average mobile CTR for display ads fluctuates from 0.41% to 0.89%, while search ads enjoy the range of between 3.05% and 5.36%.
Cost per Click (CPC)
The Cost per click (CPC) metric is used to specify how much an advertiser pays to the ad platform every time that someone clicks on their ad. The following formula will help you work that out:
CPC = Total Ad Spend / Total Measured Clicks
On Google Ads, the average CPC for display ads vary from $0.41 to $0.81. This range increases to $1.01–$4.85 for mobile search ads.
Click-to-install time (CTIT)
Advertisers lose huge amounts of money to ad fraudsters.
According to the recent study by Juniper Research, the total loss figure for 2019 is $42 billion, and it is expected to hit $100 billion by 2023.
Advertising fraud takes many forms, such as manipulating impressions with banners and ads hidden so that users can’t actually see them; imitating user clicks with click bots; and click farms.
To identify fraudulent patterns, you should be aware of the click-to-install time (CTIT) a.k.a. the time to install (TTI) metric that shows you the time interval from an ad click to the first open of the newly installed app.
This metric only takes into account the installs that have been validated by users opening the app.
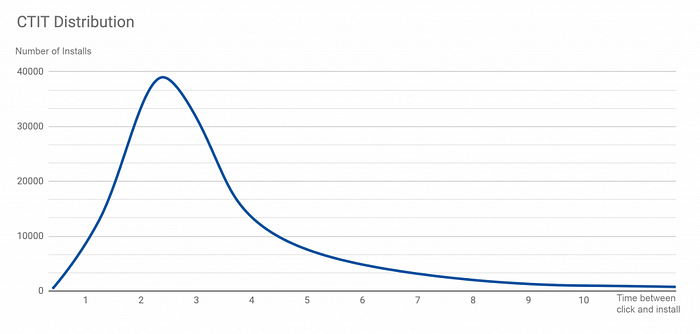
For the big picture, advertisers should look at the CTIT distribution, or the average number of hours until the first open per number of installs. An abnormal or unexpected distribution of CTIT indicates that there might be a fraudulent activity in ad delivery.
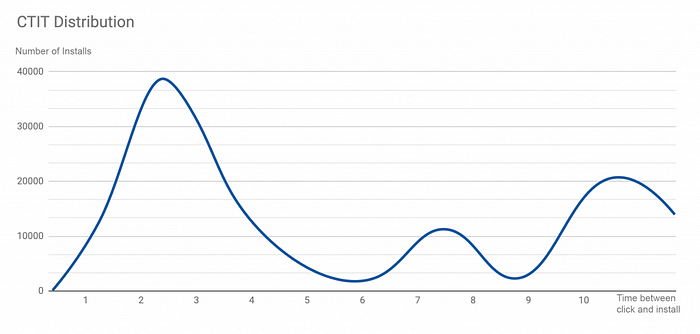
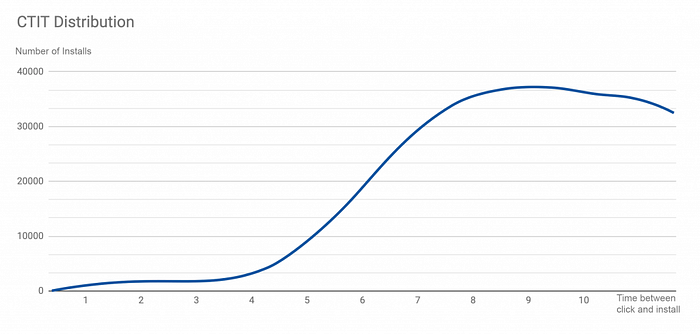
Interceptd, a mobile ad fraud prevention platform, demonstrates this in the following three charts:
A normal/expected CTIT distribution:
An abnormal/unexpected CTIT distribution:
Monitor CTIT to find out whether the ad network or app publisher you partner with allows fraud which results in the waste of your advertising budget. You can use services like Protect 360 by AppsFlyer, Interceptd, and Scalarr to do that and take action if necessary.
Top Tracking and Analytics Tools
If you are unsure about where you can get the latest data on the app performance indicators mentioned in this article, we have you covered. Use the following services:
- Global mobile app analysis: AppAnnie and Sensor Tower
- Product analytics: Amplitude
- Attribution: Adjust, AppsFlyer, Facebook Analytics
- Google Universal Analytics
Conclusion
Now that you know what key mobile app metrics are, you can confidently plan your product’s future and business down to the smallest detail. However raw your forecasts may be at this point, you can find a way to convince investors to back you.
We at Intetics Inc. have helped multiple founders make a market-ready product. If you are unsure about how to proceed with your mobile app idea, we will be happy to share our experience with you — just contact us.
https://intetics.com/blog/mobile-app-monetization-key-metrics